Nonprofit Resources
How “Stressed” Is Your Institution?
Higher education prognosticators were predicting the demise of the industry well before the World Health Organization identified a novel coronavirus in January 2020. The need for an updated roadmap for institutions of higher education (IHE) became urgent when the resulting COVID-19 disease was declared a pandemic in March 2020.Just in time, The College Stress Test: Tracking Institutional Futures across a Crowded Market was published on February 25, 2020. Let’s take a look at some of the insight it provides and how you might apply it at your organization.
Understanding the Market Trends
Authors Robert Zemsky, Susan Shaman, and Susan Campbell Baldridge identify the higher education market as the total of all students currently enrolled in a college or university. These are buyers, not shoppers. Though the population of high school graduates changed from 2008 – 2016 and is expected to continue to contract, the number of students enrolled at IHEs increased at a constant rate in that same period. The market appears to be expanding, not contracting. Elite institutions are getting richer. Big institutions are getting bigger.
Nathan Grawe noted similar trends in his 2018 book, Demographics and the Demand for Higher Education. Grawe points to the Great Recession as ushering in a demographic storm decades in the making. Grawe’s focus is on shoppers — the population of students who will be enrolled in a college or university.
Grawe developed the Higher Education Demand Index (HEDI) as a means of predicting future demand for IHE attendance. Overall demand is expected to be flat through the year 2025 but greatly impacted by type, rank, and geography. According to Grawe, the Northeast and Midwest expect to lose 5% of their college-aged population by 2025. Fertility rates in response to the Great Recession will result in a 15% drop in the number of college-age students beginning in 2026.
Understanding Your Institution’s Viability
Given the market trends, it’s vital for institutions to understand their viability, and The College Stress Test provides a framework for a risk analysis that does just that. Institutions calculate their risk score based on alerts and warnings, looking at trends over time.
The book notes four indices that measure the change in market position over a period of eight years:
- Market price (income stability);
- Enrollment (magnitude of the percentage change in the number of first-year students);
- Retention (first-to-second-year retention); and
- Endowment to expenses (control of expenses).
Once your institution has graphed each index for the period, you will draw a trend line. If the slope crosses the alert line, add 1; if it crosses the warning line, add 1; and if the trend is projected to reach the alert line by three years into the future, add 1. Each index has a potential score of 0 – 3, with a potential total score of 12. Institutions with a score above 4 face substantial risk.
Applying Methodology from the Book to Understand if Your Institution Is at Risk
Start by using specific Integrated Postsecondary Education Data System (IPEDS)-defined variables used in the analysis in the book, as outlined below. Then choose an appropriate timeframe for calculating the percentage change over time and for fitting a trend line to obtain predictions for future years.
We recommend that you select the most recent year for which you have institutional data that complies with IPEDS definitions and then obtain your IPEDS submissions for the seven years prior. Follow these steps to compute the percent change from the base year to the present year and construct a trend line to project three years into the future:
- Chart your data
- Calculate component scores that sum to the Market Stress Test Score provided in the book
- Compare your component scores to cutoffs used in the book
You can use Excel for this. The book provides templates with formulas.
Now let’s look at example calculations of the components in the book. The charts below reflect an example stress test for School A, a denominational liberal arts university in the South. School A is located in a suburban city approximately 90 minutes away from a major city, and there is another four-year private liberal arts college located nearby. This IHE experienced significant declines in its nontraditional program beginning in 2012 and has sustained operating losses since that time.
We will also discuss example results from School B, also a denominational liberal arts university in the South and located in a suburban area with direct access to a major interstate. School B has experienced incredible growth in its student body and plans to build additional dorms to accommodate this growth. This IHE has experienced extraordinary operating surpluses by both growing its revenue and carefully managing its expenses. All of its benchmarking ratios and Education Department scores indicate incredible financial health.
Enrollment
This component compares the number of first-year students enrolled in the fall of each year in the period you selected. The example chart below shows the percentage change in first-year enrollment, with actual enrollment numbers indexed by setting 2012 to 100. You can see that the 2019 enrollment is at 80, indicating a 20% decline from 2012. Since the negative trend line crosses both the alert and warning thresholds and is negative three years into the future, School A scores a 3 on this component.
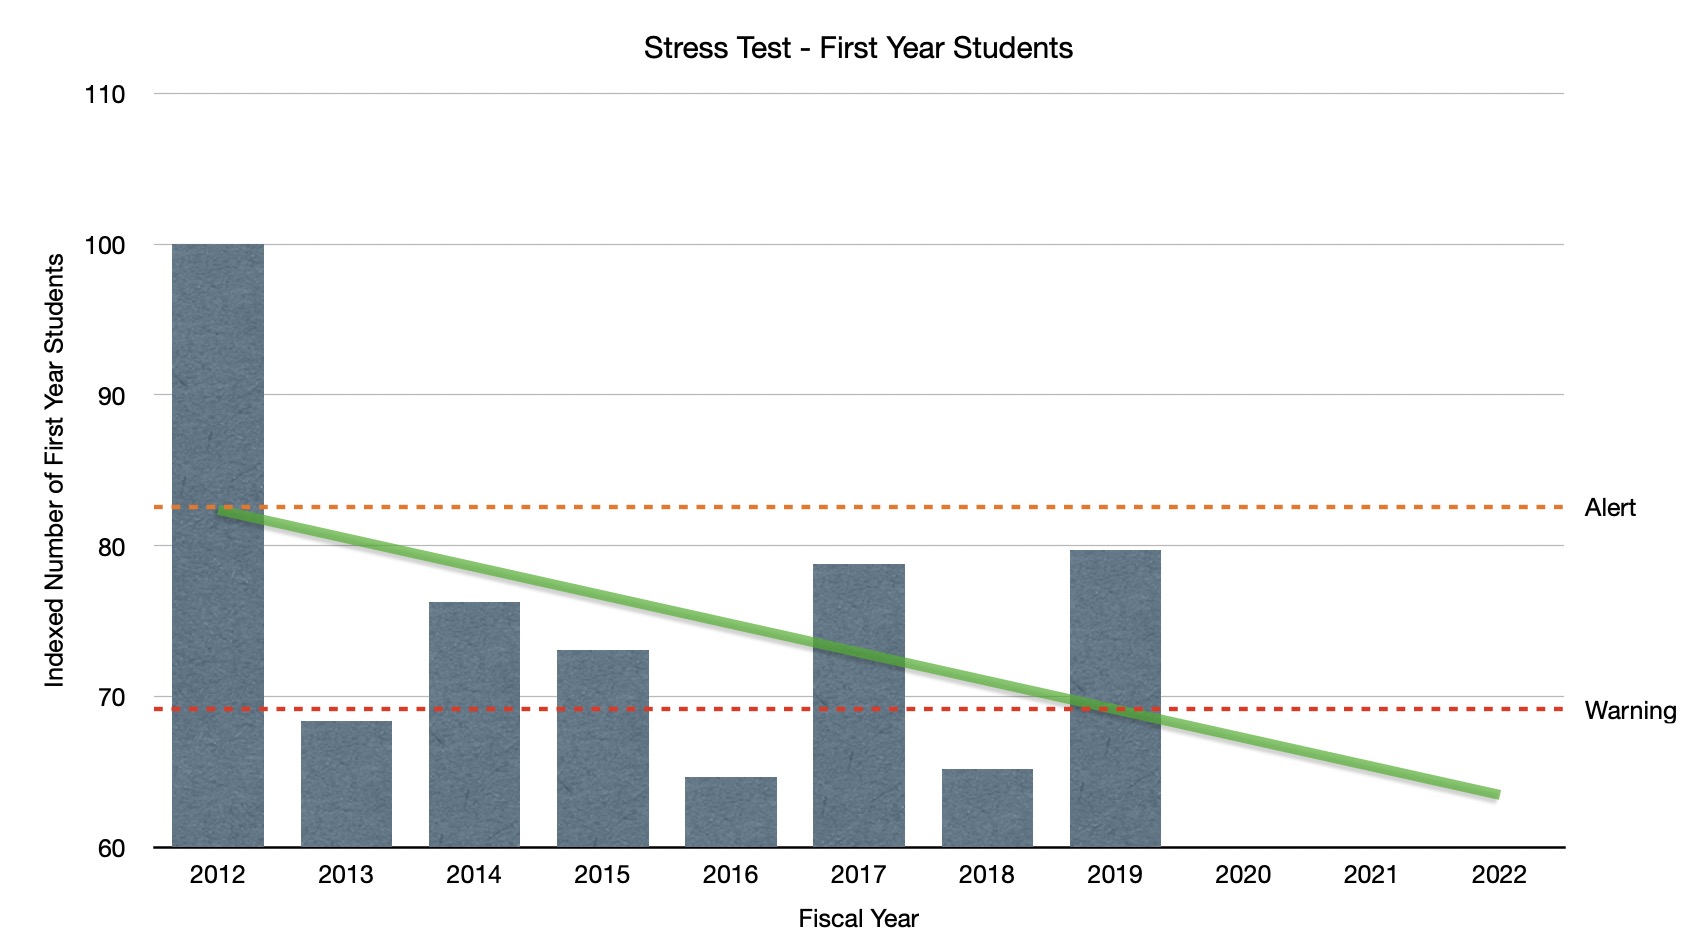
Not surprisingly, School B scored a 0 on this component. This tracks with its year-over-year increase in tuition revenue as more students enroll.
Retention
This component uses the first-to-second-year student retention rate to determine how many students in the first-year full-time cohort came back the next year. In our example, School A scores a 3 on this component as well, with 2019 showing that only 55% of 2018 freshmen returned as sophomores in 2019. This is below the warning threshold of 56.4%. The slope is negative, crossing both alert and warning thresholds.
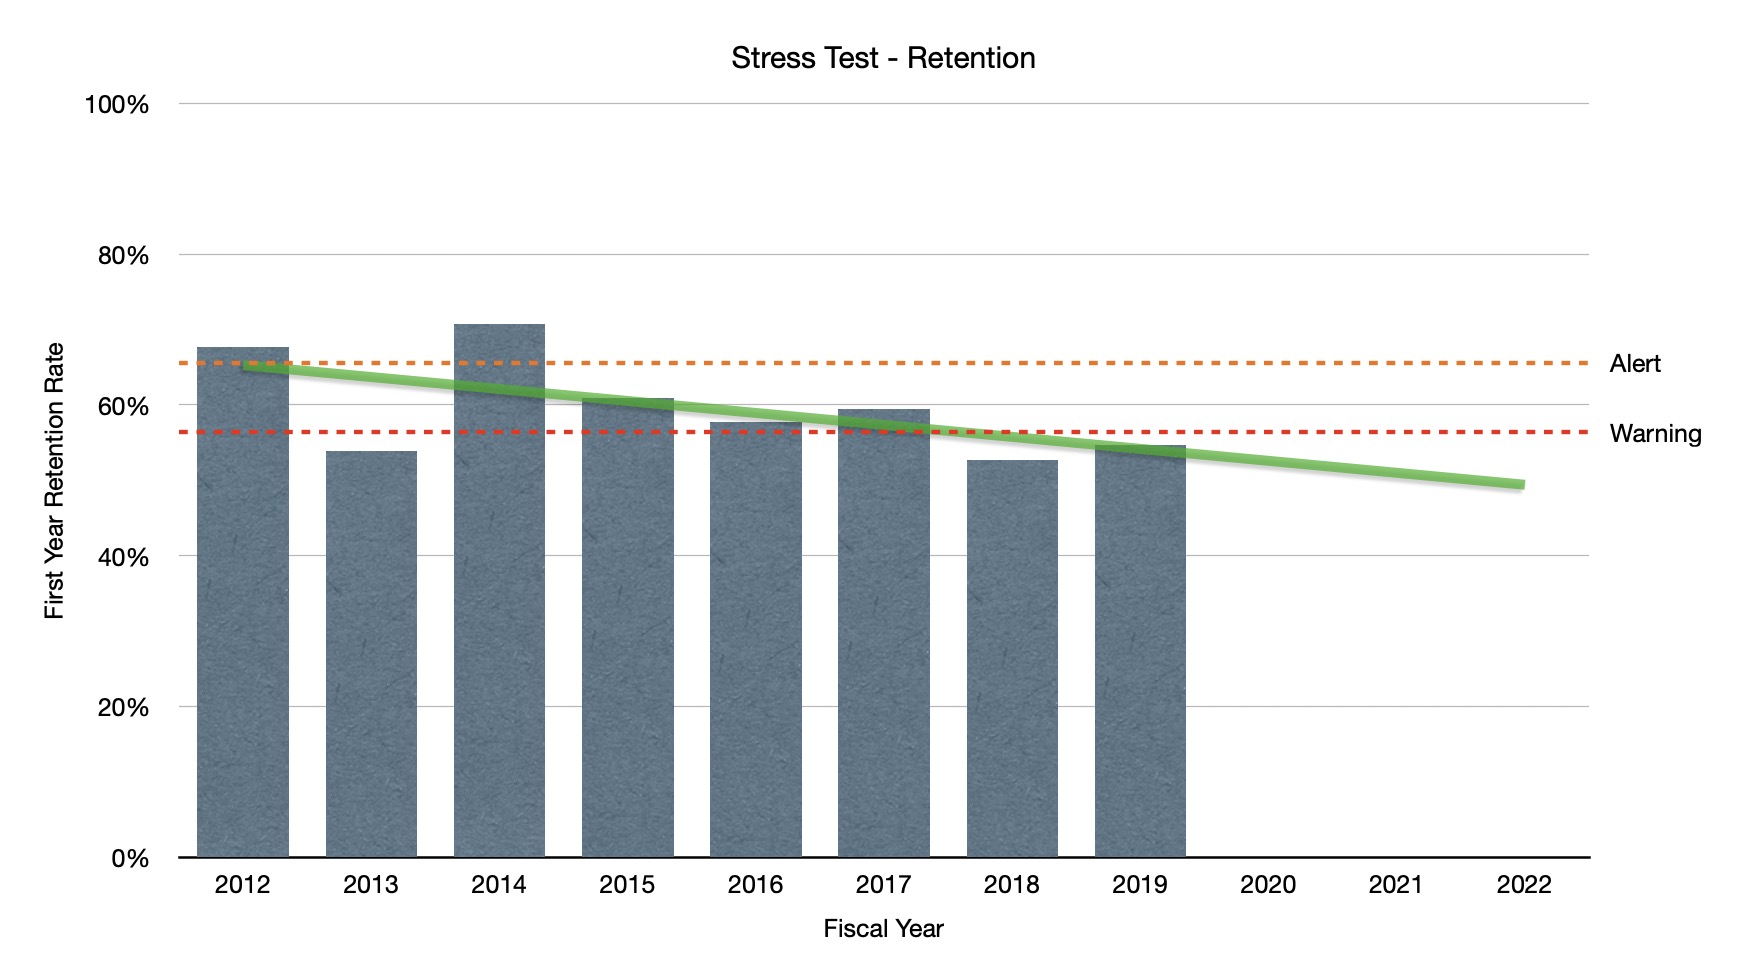
School B scored a 0 on this component, illustrating that it has been incredibly successful both in drawing new students in and convincing them to return for another year.
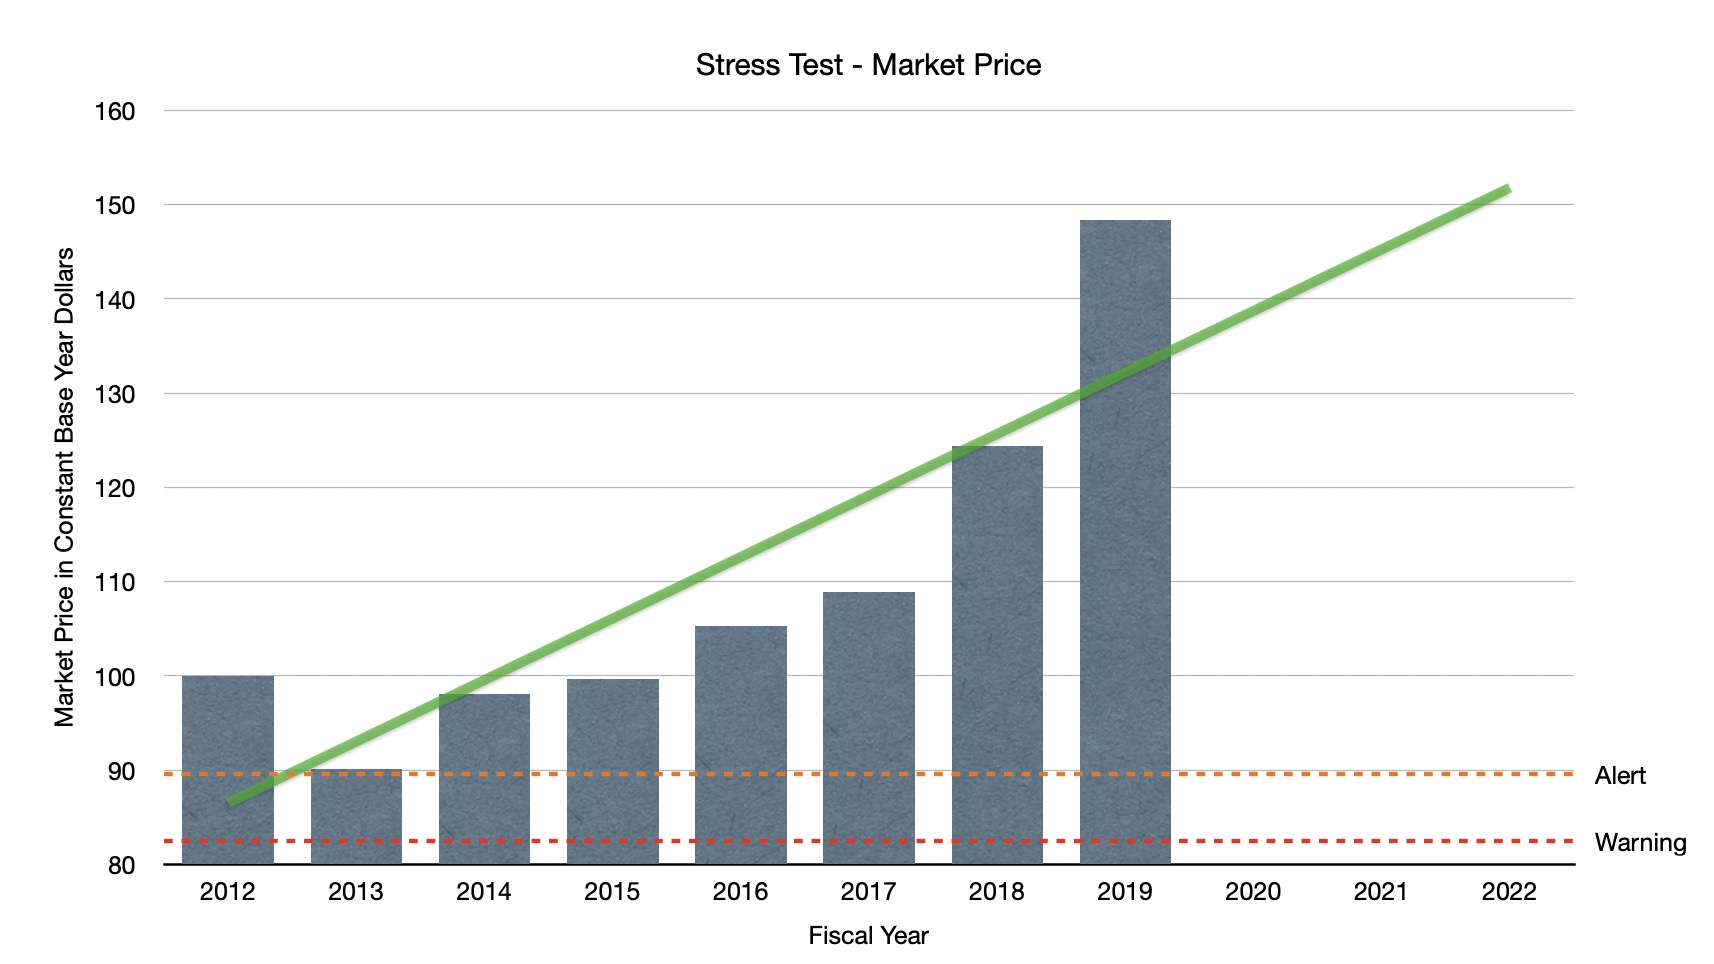
Market Price
The first of the only two financial measures in the stress test, this component looks at your institution’s stated tuition and fees less average institutional grants to first-year, full-time students. It is a measure of income stability in constant (real) base dollars.
The chart below, for our example School A, is cast in constant 2012 dollars by setting 2012 values to 100. It shows the change in market price. Both School A and School B (not shown) scored a 0 on this component. A negative trend line would indicate the IHE is awarding students faster than it is increasing its sticker price. Keep in mind that IPEDS only shows institutionally funded aid for full-time first-year students, so this component is a good measure of an IHE’s difficulty in recruiting a new class each year.
Endowment to Expense Ratio
The second financial component measures an IHE’s control over its expenses. The score isn’t based on the absolute ratio; instead, it’s computed using the change in the ratio from 2012 to 2019. The chart shows the changes in the ratio with each year indexed by setting 2012 to 0. A positive trend line would indicate either a growing endowment, a decrease in expenses, or both. In this case, School A managed to decrease its expenses proportionally to their decrease in revenue while endowment assets remained flat.
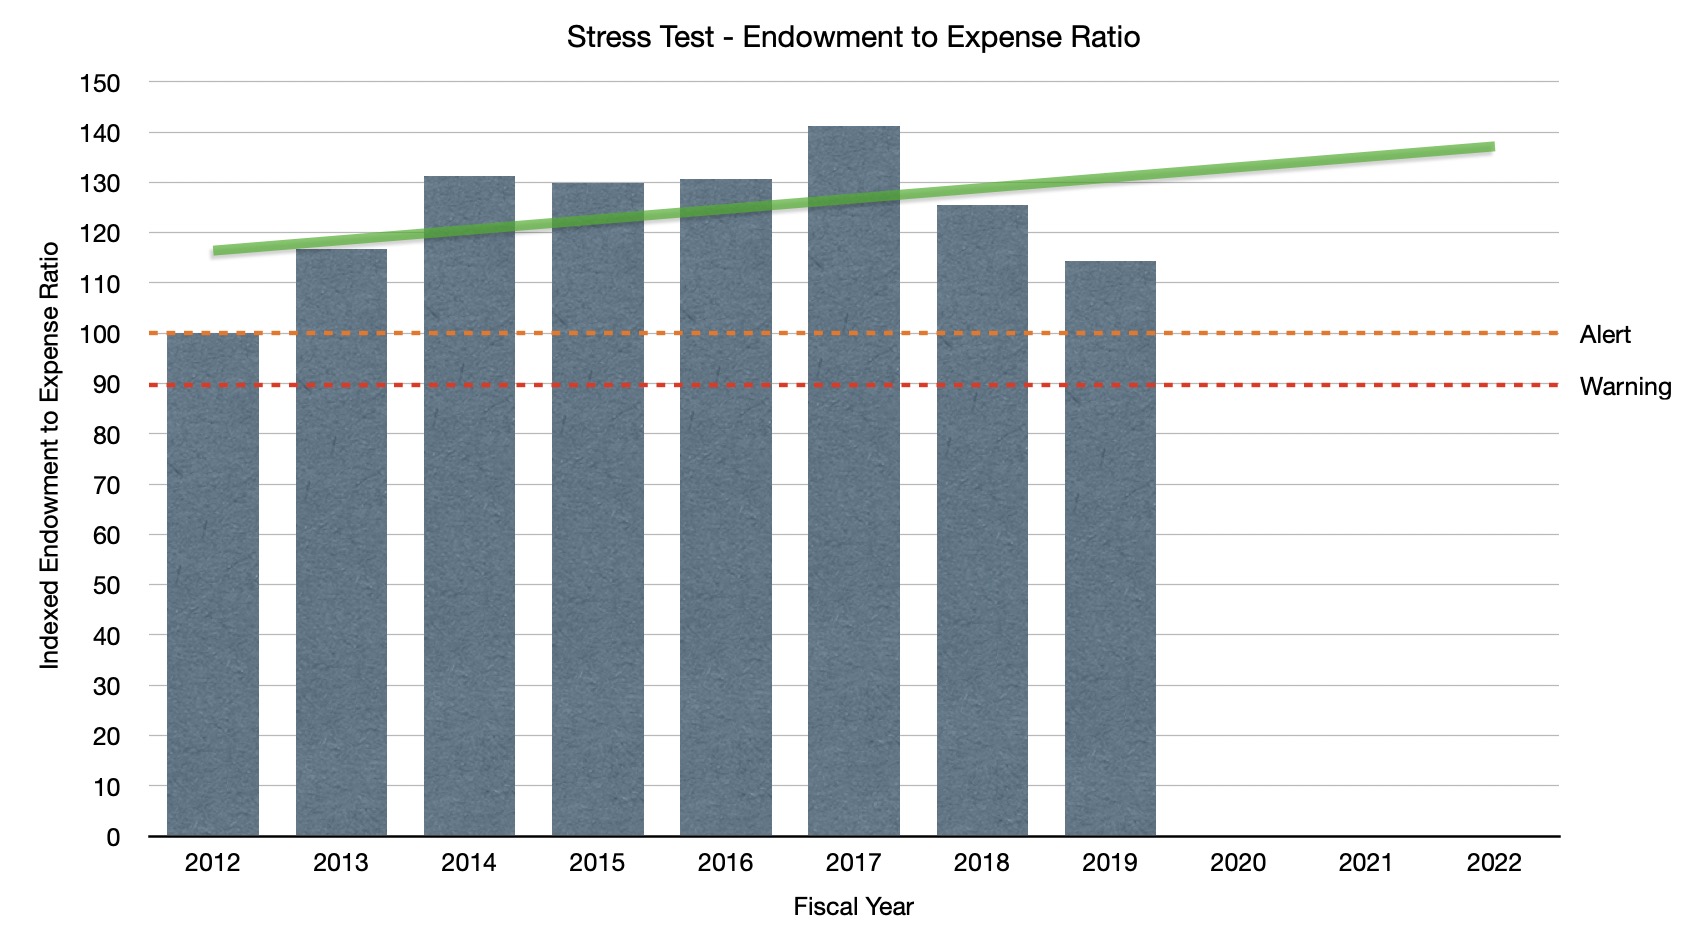
Hitting the alert threshold with a negative trend line, School B surprisingly scored a 2 on this component. If you looked purely at the financial statements, you would see that School B’s endowment at the end of fiscal year 2019 was almost double that of School A and that its endowment grew 64% between 2012 and 2019. However, you would also see that its expenses grew 77% in that same period. While School B had remarkable growth in its endowment, its growth in enrollment is even more remarkable.
Based on financial results and industry ratios, our example School B appears to be thriving and growing, the picture of health. School A has sustained operating losses and has consistently failed key ratios, and its financial outlook appears to be bleak. While School A’s total Market Stress Test score is 6, indicating substantial viability risk, School B’s score is 2, which is expected when looking at its overall picture.
Remember, the market stress test is a reflection of an IHE’s market viability, and it tells a different story than financial forecasting.
How This Can Help Your Organization Navigate the Pandemic
The authors constructed stress test scores for 900 private four-year nonprofit institutions using IPEDS data from 2008 – 2016. One of the objectives associated with each score (for a potential of 12 total points, with a score of 4 or more indicating substantial risk) is forecasting three years ahead, which in the case of these 900 schools was 2019. Of the 900 schools, 159 (17.7%) are estimated to be at substantial risk.
An additional item of note: the stress test shows that of those 900 schools, 40% with fewer than 500 undergrad enrollments faced substantial risk. We already knew the bad news about market competition when this book was published in February 2020… and then COVID-19 canceled everything.
You probably tossed your 2021 budget back in March and are budgeting for multiple scenarios. Using those scenarios, you are also likely looking at key ratios and scores to plan ahead for missed debt covenants and declining Education Department viability scores. We urge you to also consider using the inputs for those scenarios to forecast what your trend lines and stress test scores might look like. It’s vital to know not only your financial outlook but also your market outlook. Your trend line might have been positive pre-COVID-19, but the future has become more fluid and unknown. Though we have good reason to believe the pandemic will be over in three years, planning for multiple outcomes is essential.
The College Stress Test suggests two ways to change the trajectory of a negative sloping trend line:
- Focus on market strategies, including pricing policies; and
- Change internal institutional behavior to improve marketing and retention of first-year, first-time students.
Two of the four stress test components are purely enrollment-driven; perhaps now is the time to rethink your institution’s general education curriculum in order to improve first-year to second-year retention. As you strategize ways to elevate your institution’s brand, consider exploring what a tuition reset would look like.
Finally, now that you’ve used technology to remotely close out 2020, consider how you can continue to use that technology to reduce instructional expenses. Strategizing how to respond to a substantial risk for closure will require all hands on deck.
The systemic shock of the COIVD-19 pandemic will change the landscape of higher education in perpetuity. Institutions that reconsider the curricula they deliver, the prices they charge, and their willingness to experiment with additional modes of instruction may continue to struggle, but they likely will continue to exist.
Please contact us with questions or to discuss how we can assist your institution.
Additional resources:
After Coronavirus, Colleges Worry: Will Students Come Back? – The New York Times
Considerations for Reducing Expenses at Your Institution – CapinCrouse
Liquidity – The New Normal – CapinCrouse
The College Stress Test: Tracking Institutional Futures across a Crowded Market – Robert Zemsky, Susan Shaman, and Susan Campbell Baldridge

Rachel McMichael
Rachel is a Partner at CapinCrouse. She joined the firm in 2004 and provides assurance and advisory services to key clients. This includes audit, review, and consultation work in various nonprofit sectors, with a focus on the firm’s higher education practice. Her higher education expertise includes work on the higher education Data Warehouse, assisting clients with higher education financial modeling, and participating in and speaking at seminars and conferences around the country.